BOUTIQUEResources
To date, the ELISA method remains the gold standard for detecting and quantifying Host Cell Proteins (HCPs) in process monitoring and product batch release. Cygnus has been providing HCP detection kits for over 25 years, and has developed numerous patented methods to produce antibodies with broad reactivity against HCPs. Currently, it offers more than 32 types of HCP ELISA detection kits tailored to different expression platforms.
Cygnus' ELISA kits utilize pre-coated plates, where antigens and detection antibodies are added simultaneously for incubation during the assay. In reality, HCP detection is quite complex, as it primarily relies on HCP antibodies capable of reacting with thousands of HCP species. For ELISA results to be accurate, both the capture antibodies and detection antibodies targeting the antigens must be in excess. Only under the condition of excess antibodies can a dose-response curve with a positive slope be obtained, thereby enabling accurate quantification. Therefore, a rational plate layout setup is an excellent starting point.
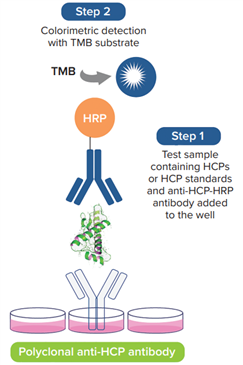
Basic Procedure for Cygnus HCP ELISA Assay
I. HCP ELISA Plate Layout Specifications
1. Requirement for Technical Replicates
A triplicate well design is recommended, as it is the most effective approach. It allows for the identification and elimination of potential outliers and provides more information when troubleshooting issues after the experiment. It should be noted that if the number of test samples does not support triplicate wells, at least duplicate wells must be set up—detection without any technical replicates is considered invalid. If possible, it is preferable to set up triplicate wells for both standards and controls.
2. Blank Control
Setting up additional blank controls is not recommended. Subtracting blank control values will not improve experimental results; in fact, it may even lead to an increase in the Coefficient of Variation (CV). For details, please refer to the document How Should Blank Controls Be Set Up When Using Cygnus ELISA Kits?.
3. Setting Up Positive Controls
Use a standard within the mid-concentration range of the standard curve as the positive control (low-concentration standards are more affected by assay sensitivity). When using a positive control derived from HCP standards, the mid-concentration point of the curve typically provides the most information.
4. Setting Up Negative Controls
Use sample dilution buffer as the negative control to evaluate whether there is a significant deviation between the 0-concentration standard and the dilution buffer used.
5. Setting Up 1–2 Additional HCP Controls
A well-characterized in-process sample from the manufacturing workflow can be used as an additional HCP control. If there are extra wells available, setting up two dilutions of this sample is more effective than using only one dilution.
6. Optimizing Sample Loading with Low-Bind Plates
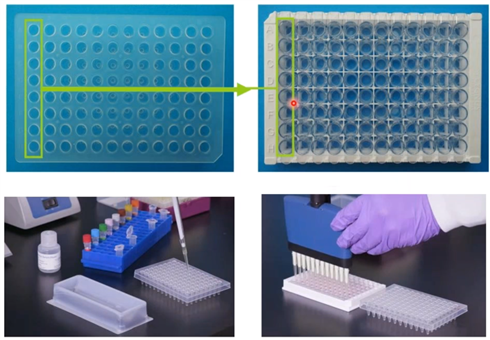
When loading samples into the well, the most important considerations are: how long each step will take and the direction of movement for each step. To address this, pre-aliquot the test samples and enzyme-conjugated secondary antibodies into a low-bind plate first, then transfer the entire volume to the assay plate. This method significantly reduces sample loading errors when adding samples to the assay plate.
II. Example of ELISA Plate Layout
The optimal way to arrange samples is to place standards on the left side of the plate and controls (negative or positive) on the right side. Meanwhile, factors such as the number of technical replicates required, sample dilution gradients, and the direction of movement during sample loading and plate washing must also be considered.
By placing standards and quality control samples on opposite sides of the plate, you ensure that the same information can be obtained from either side of the plate. This clearly reveals any operational errors that may occur during sample loading or plate washing, and adjusting the positions of these wells within the plate enables more effective troubleshooting.
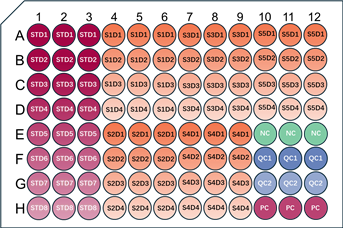
1. Recommended Schematic for Triplicate Well Layout
For 5 samples with 4 dilution gradients: all standards, samples, and controls are set up in triplicate wells.
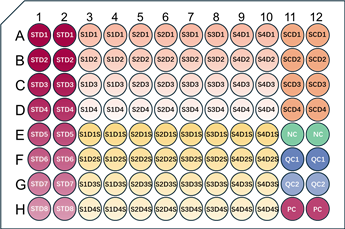
2. Recommended Schematic for Duplicate Well Plate Layout
For 4 samples and spiked control samples, 4 dilution gradients are set for each. All standards, samples, and control samples are arranged in duplicate wells.
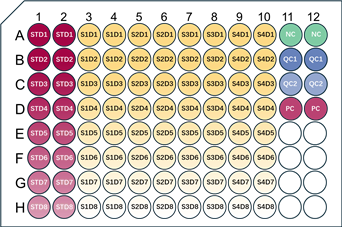
3. Recommended Schematic for Plate Layout of HCP Samples with Unknown Concentrations
For 4 samples, 8 dilution gradients are set up to collect most of the information about samples with unknown HCP levels.
Additional plate layout examples can be found at the end of the document.
III. Troubleshooting and Solutions for Common HCP ELISA Plate Layout Issues
1. Sample Loading Problems
During the HCP ELISA assay, every 2 minutes of static incubation is equivalent to 1 minute of shaking incubation. In other words, if sample loading takes 20 minutes, the samples added first will have an incubation time 10 minutes longer than those added last. Suppose the shaking incubation time is set to 1 hour, while sample loading alone takes 20 minutes—this will inevitably lead to differences in binding efficiency between the samples added earlier and later. Specifically, the samples added first will show abnormally high Optical Density (OD) values.
Therefore, the core principle of sample loading is to ensure that the incubation time is as consistent as possible across all wells in the plate. If a large number of samples need to be tested at one time, to avoid excessive time spent on sample loading, we recommend pre-adding the samples and enzyme-conjugated antibodies into a low-bind plate first, then quickly transferring them to the assay plate using a multi-channel pipette. Practice has proven that this operation method can effectively resolve result abnormalities caused by differences in sample loading time.
2. Plate Washing Problems
Improper plate washing operations can also lead to abnormalities in assay results. Similar to sample loading, the core principle to follow for HCP ELISA plate washing is alternating-direction washing—that is, ensuring the total washing time is as consistent as possible across all wells. For precautions regarding plate washing operations, please refer to the document How to Resolve ELISA Assay Result Drift with Correct Plate Washing Methods?.
IV. Common Error Cases and Improvement Methods
Case 1: Errors Caused by Slow Sample Loading
If the same sample is loaded slowly into each well in the direction from Row A to Row H and Column 1 to Column 12 sequentially, this loading method will affect the assay results—even if the correct plate washing method is adopted. The following heatmap example shows what happens when the same sample is added to the microplate at a slow speed.
|
|
1 |
2 |
3 |
4 |
5 |
6 |
7 |
8 |
9 |
10 |
11 |
12 |
|
A |
1.000 |
0.976 |
0.952 |
0.928 |
0.904 |
0.880 |
0.856 |
0.832 |
0.808 |
0.784 |
0.760 |
0.736 |
|
B |
0.997 |
0.973 |
0.949 |
0.925 |
0.901 |
0.877 |
0.853 |
0.829 |
0.805 |
0.781 |
0.757 |
0.733 |
|
C |
0.994 |
0.970 |
0.946 |
0.922 |
0.898 |
0.874 |
0.850 |
0.826 |
0.802 |
0.778 |
0.754 |
0.730 |
|
D |
0.991 |
0.967 |
0.943 |
0.919 |
0.895 |
0.871 |
0.847 |
0.823 |
0.799 |
0.775 |
0.751 |
0.727 |
|
E |
0.988 |
0.964 |
0.940 |
0.916 |
0.892 |
0.868 |
0.844 |
0.820 |
0.796 |
0.772 |
0.748 |
0.724 |
|
F |
0.985 |
0.961 |
0.937 |
0.913 |
0.889 |
0.865 |
0.841 |
0.817 |
0.793 |
0.769 |
0.745 |
0.721 |
|
G |
0.982 |
0.958 |
0.934 |
0.910 |
0.886 |
0.862 |
0.838 |
0.814 |
0.790 |
0.766 |
0.742 |
0.718 |
|
H |
0.979 |
0.955 |
0.931 |
0.907 |
0.883 |
0.859 |
0.835 |
0.811 |
0.787 |
0.763 |
0.739 |
0.715 |
Improvement Method:
First, pre-add the enzyme-conjugated antibodies and samples into a low-bind plate. Then, use a multi-channel pipette to quickly transfer all samples to the assay plate for incubation. This method can effectively reduce the time difference in sample loading between different wells, ensure the incubation time of all wells is as consistent as possible, and thereby reduce the probability of outliers.
Case 2: Errors Caused by Plate Washing in the Same Direction
If the washing buffer is added in the same direction for all 4 washing cycles, it will also affect the assay results. The following heatmap example shows what may happen when the washing buffer is added in the direction from Column 1 to Column 12 using a multi-channel pipette for all 4 plate washing cycles.
|
|
|
1 |
2 |
3 |
4 |
5 |
6 |
7 |
8 |
9 |
10 |
11 |
12 |
|
A |
|
0.670 |
0.700 |
0.730 |
0.760 |
0.790 |
0.820 |
0.850 |
0.880 |
0.910 |
0.940 |
0.970 |
1.000 |
|
B |
|
0.670 |
0.700 |
0.730 |
0.760 |
0.790 |
0.820 |
0.850 |
0.880 |
0.910 |
0.940 |
0.970 |
1.000 |
|
C |
|
0.670 |
0.700 |
0.730 |
0.760 |
0.790 |
0.820 |
0.850 |
0.880 |
0.910 |
0.940 |
0.970 |
1.000 |
|
D |
|
0.670 |
0.700 |
0.730 |
0.760 |
0.790 |
0.820 |
0.850 |
0.880 |
0.910 |
0.940 |
0.970 |
1.000 |
|
E |
|
0.670 |
0.700 |
0.730 |
0.760 |
0.790 |
0.820 |
0.850 |
0.880 |
0.910 |
0.940 |
0.970 |
1.000 |
|
F |
|
0.670 |
0.700 |
0.730 |
0.760 |
0.790 |
0.820 |
0.850 |
0.880 |
0.910 |
0.940 |
0.970 |
1.000 |
|
G |
|
0.670 |
0.700 |
0.730 |
0.760 |
0.790 |
0.820 |
0.850 |
0.880 |
0.910 |
0.940 |
0.970 |
1.000 |
|
H |
|
0.670 |
0.700 |
0.730 |
0.760 |
0.790 |
0.820 |
0.850 |
0.880 |
0.910 |
0.940 |
0.970 |
1.000 |
Improvement Method:
It is recommended to perform plate washing in alternating directions—specifically, add the washing buffer from opposite directions for the 1st and 3rd washing cycles versus the 2nd and 4th washing cycles.
V. Cases of Abnormal HCP ELISA Results and Troubleshooting
As shown in the figure below, the test results exhibit a decreasing trend from left to right among the technical replicates of the samples. Additionally, the Optical Density (OD) values of both the negative controls and positive controls on the right side of the plate are lower than those on the left side. The inconsistency between the positive control results on the two sides indicates that this experiment is a failure.
Furthermore, the average difference in OD values among the negative control replicates on the left side is 0.01, while the OD values of the negative controls on the right side are close to the background level. Therefore, additional information is required to further determine whether the issue stems from sample loading or plate washing.
In summary, the possible causes of the failure in this experiment are:
1. Slow sample loading;
2. Failure to perform plate washing in alternating directions.
|
|
1 |
2 |
3 |
4 |
5 |
6 |
7 |
8 |
9 |
10 |
11 |
12 |
|
A |
STD 1 |
Sample 1 Dilution 1 |
Sample 3 Dilution 1 |
Sample 5 Dilution 1 |
||||||||
|
B |
STD 2 |
Sample 1 Dilution 2 |
Sample 3 Dilution 2 |
Sample 5 Dilution 2 |
||||||||
|
C |
STD 3 |
Sample 1 Dilution 3 |
Sample 3 Dilution 3 |
Sample 5 Dilution 3 |
||||||||
|
D |
STD 4 |
Sample 1 Dilution 4 |
Sample 3 Dilution 4 |
Sample 5 Dilution 4 |
||||||||
|
E |
STD 5 |
Sample 2 Dilution 1 |
Sample 4 Dilution 1 |
Negative Control (Diluent) |
||||||||
|
F |
STD 6 |
Sample 2 Dilution 2 |
Sample 4 Dilution 2 |
Control Dilution 1(External HCP) |
||||||||
|
G |
STD 7 |
Sample 2 Dilution 3 |
Sample 4 Dilution 3 |
Control Dilution 2 (External HCP) |
||||||||
|
H |
STD 8 |
Sample 2 Dilution 4 |
Sample 4 Dilution 4 |
Postive Control (STD 5 repeat) |
||||||||
|
|
1 |
2 |
3 |
4 |
5 |
6 |
7 |
8 |
9 |
10 |
11 |
12 |
|
A |
2.500 |
2.450 |
2.400 |
1.200 |
1.150 |
1.100 |
2.000 |
1.950 |
1.900 |
1.700 |
1.650 |
1.600 |
|
B |
1.200 |
1.150 |
1.100 |
0.600 |
0.550 |
0.500 |
1.000 |
0.950 |
0.900 |
0.850 |
0.800 |
0.750 |
|
C |
0.600 |
0.550 |
0.500 |
0.300 |
0.280 |
0.260 |
0.500 |
0.480 |
0.460 |
0.425 |
0.405 |
0.385 |
|
D |
0.300 |
0.250 |
0.200 |
0.150 |
0.140 |
0.130 |
0.250 |
0.240 |
0.230 |
0.212 |
0.202 |
0.192 |
|
E |
0.150 |
0.130 |
0.110 |
1.400 |
1.350 |
1.300 |
0.125 |
0.115 |
0.105 |
0.005 |
0.005 |
0.005 |
|
F |
0.075 |
0.065 |
0.055 |
0.700 |
0.650 |
0.600 |
0.550 |
0.500 |
0.450 |
0.230 |
0.225 |
0.220 |
|
G |
0.038 |
0.033 |
0.028 |
0.350 |
0.330 |
0.310 |
0.290 |
0.270 |
0.250 |
0.115 |
0.095 |
0.075 |
|
H |
0.015 |
0.010 |
0.005 |
0.175 |
0.165 |
0.155 |
0.145 |
0.135 |
0.125 |
0.090 |
0.080 |
0.070 |
Summary
l A rational microplate layout should be planned before conducting an ELISA assay: an optimized microplate layout enables the monitoring of key performance indicators and faster troubleshooting when issues arise. For more plate layout examples, please click here to access them.
l Key considerations for HCP ELISA include: setup of technical replicates, sample dilution gradients, sample loading and plate washing operations, and setup of controls.
l Optimizing sample loading operations with low-bind plates can minimize deviations in Optical Density (OD) values.
l Do not use blank controls, as this practice will increase the coefficient of variation (CV) of the assay results.
Related product recommendations:
Product Name:Sample Treatment Plate (Sample processing plate)
Item No.:F402
Specification:1 plate

Cygnus Technologies, LLC. provides products and analytical methods for the biotechnology and biopharmaceutical industries, aiming to accelerate the research and development (R&D) phase and enhance product quality.
Cygnus develops and manufactures bioprocess residual test kits, which are used to detect specific impurities in more than 50 different expression systems.
As an expert in high-sensitivity analytical technologies focused on immunoassays for biotechnological applications, Cygnus has had its products and services adopted by nearly all major biopharmaceutical companies for over 25 years.

As the exclusive general distributor of Cygnus in China, Beijing XMJ Technology Co., Ltd. has established long-term and stable cooperative relationships with numerous well-known domestic pharmaceutical companies and CRO/CMO enterprises.
 京公網安備 11010802028692號